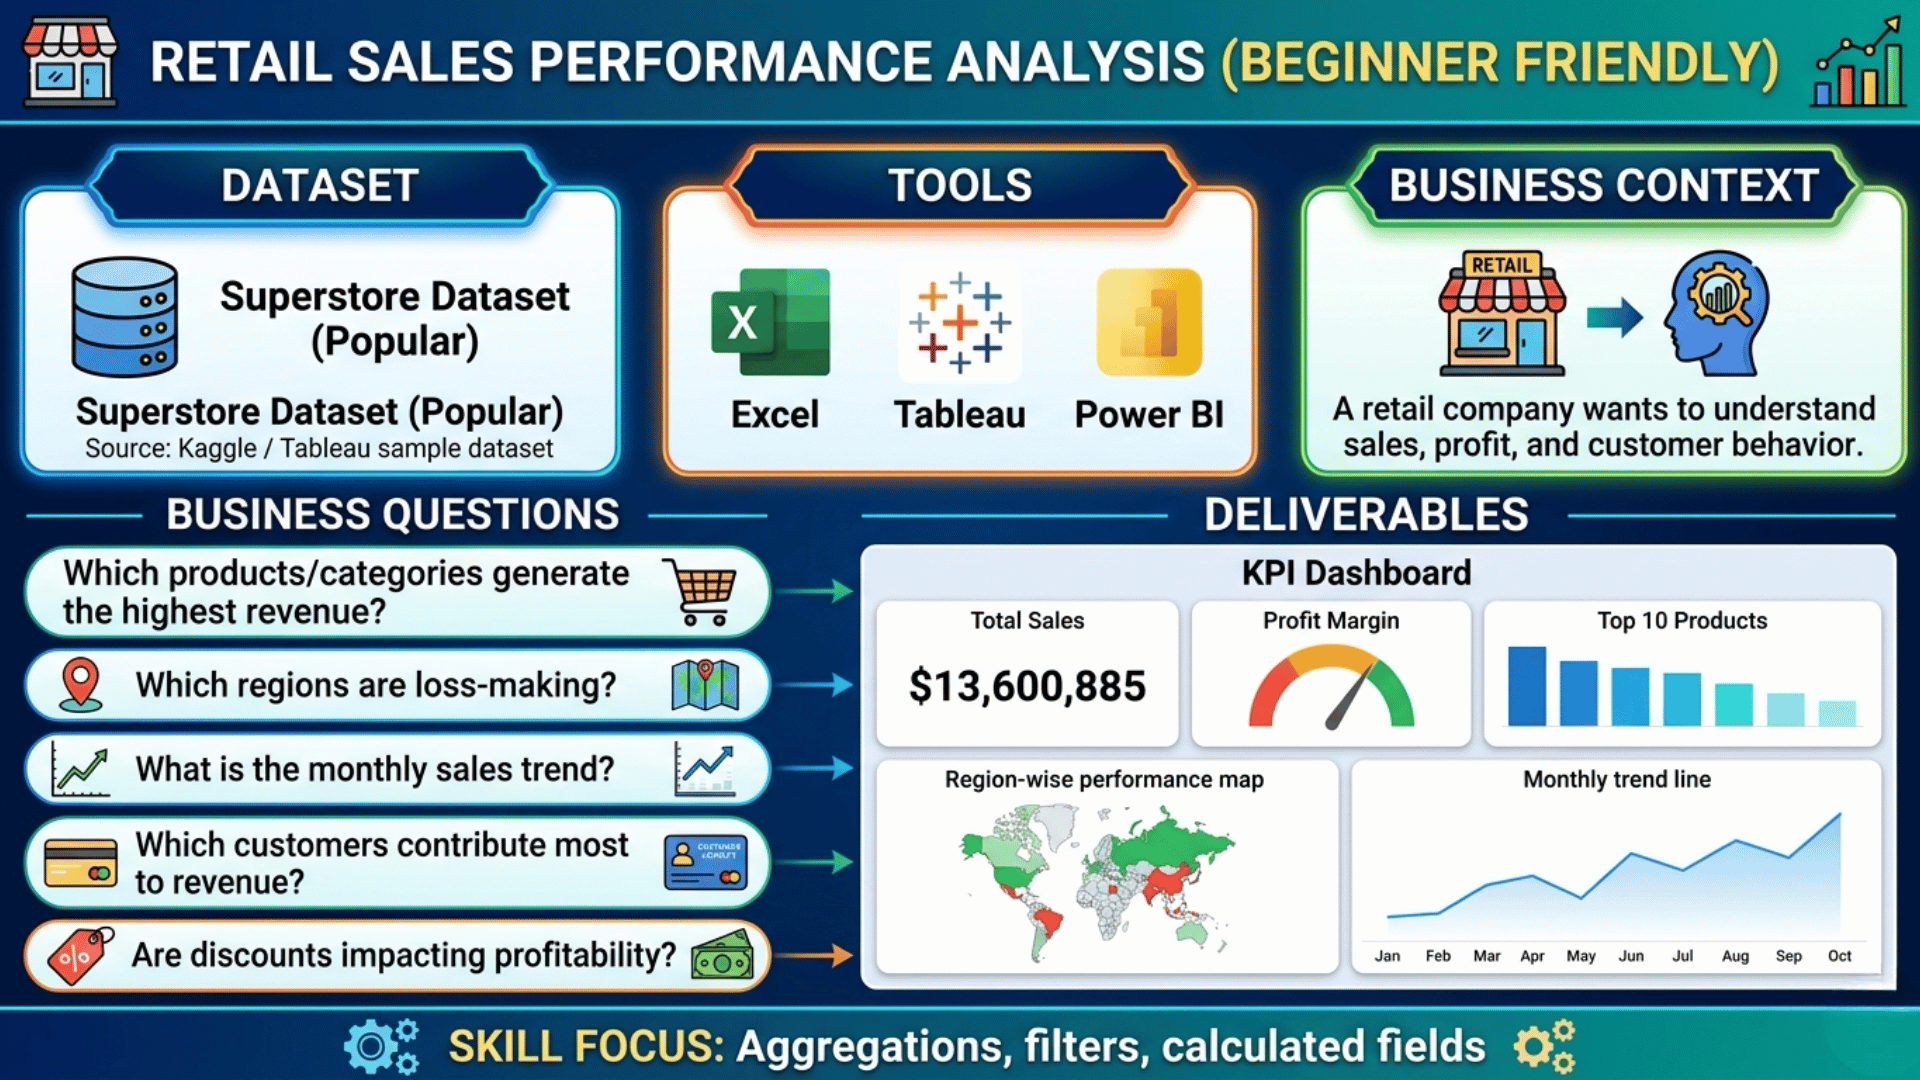
1. Retail Sales Performance Analysis
Dataset: retail_sales.csv
Tools: Excel / Tableau / Power BI
You are working as a Data Analyst for a multi-region retail company operating across diverse markets. Leadership is concerned about inconsistent profitability despite steady revenue growth. They suspect that discounting strategies, regional inefficiencies, and product mix are impacting margins.
- Which product categories and sub-categories drive both high revenue and high profitability?
- Are there regions where sales are growing but profits are declining?
- How do discount levels correlate with profit margins?
- Who are the top 20% customers contributing to 80% revenue?
- Are there seasonal patterns?
- Executive dashboard highlighting Sales, Profit, Profit Ratio
- Customer segmentation
- Regional performance heatmap
- Discount vs Profit analysis
- Strategic recommendations
While analyzing the retail data, I noticed that although overall sales were growing steadily, profitability wasn’t following the same trend. I broke down performance across regions and categories, identifying discount-heavy segments hurting margins and recommended optimizing pricing strategy.
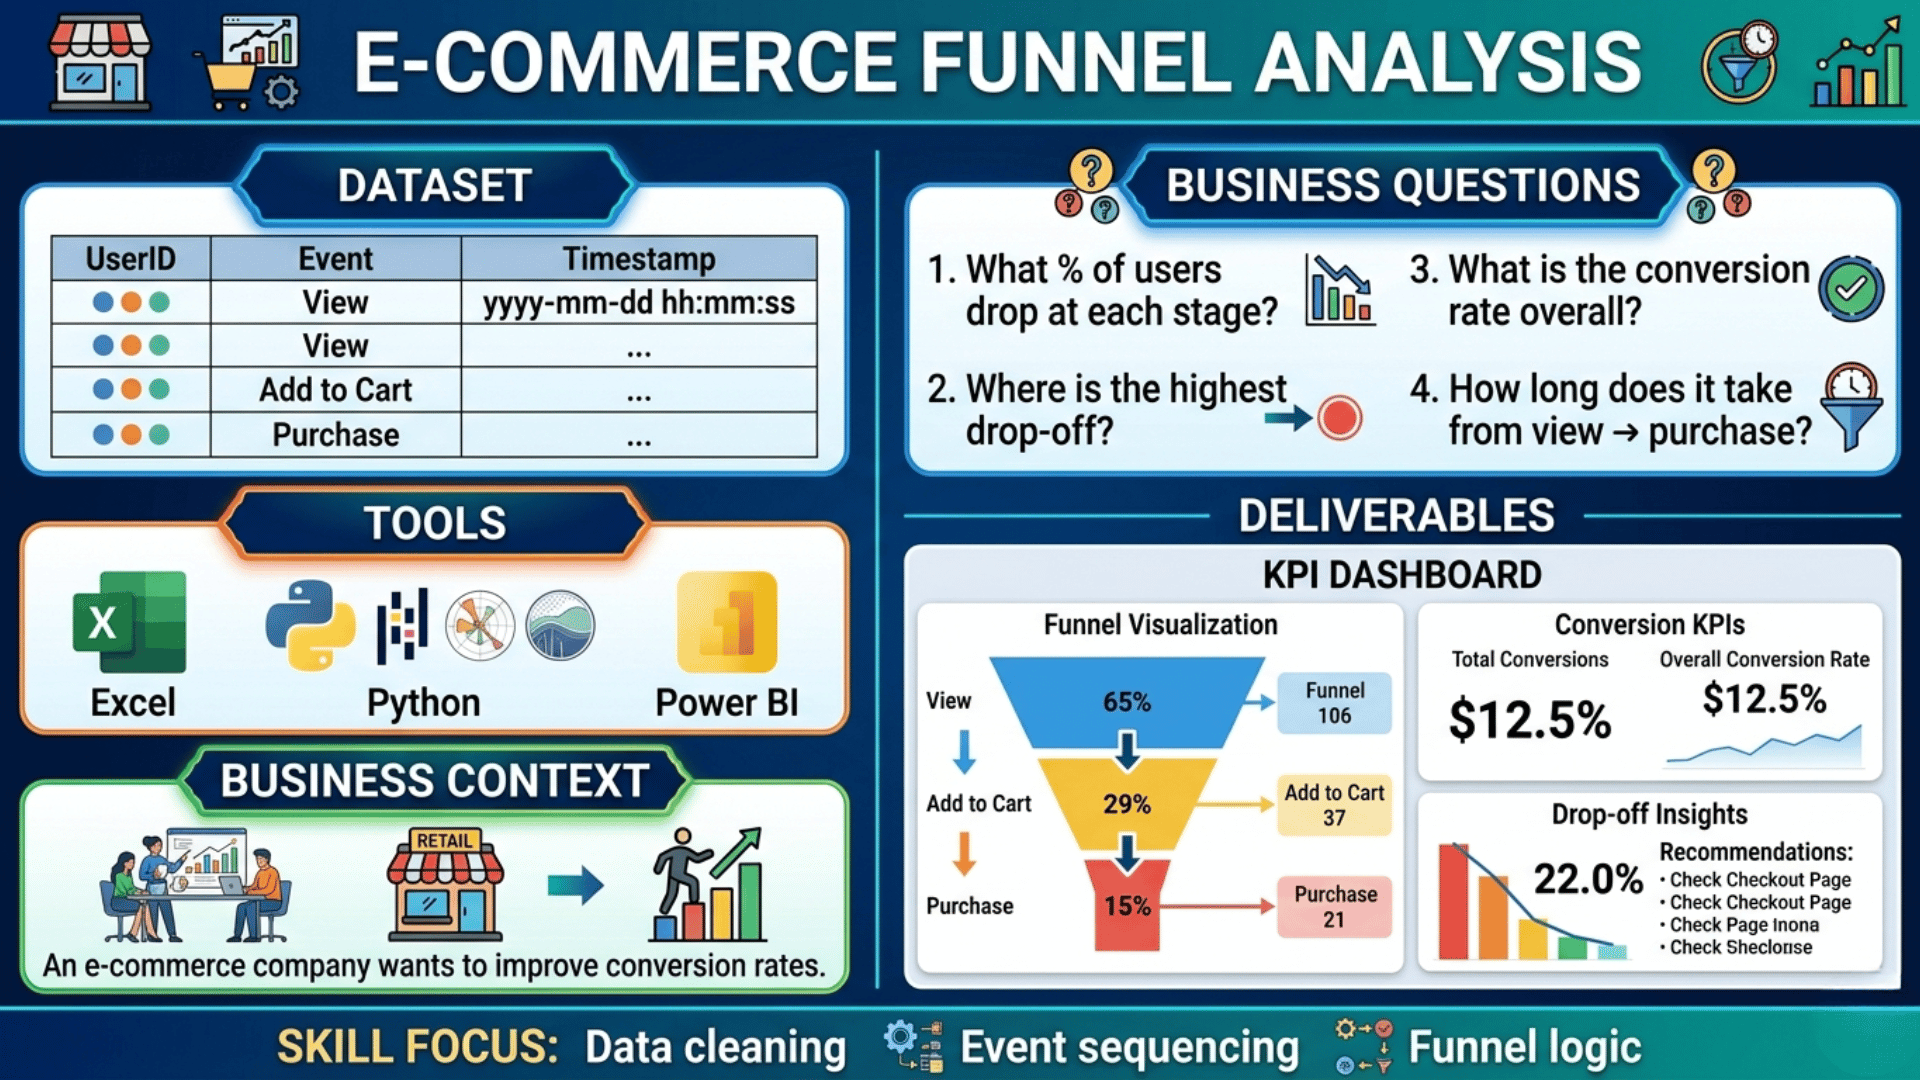
2. E-commerce Funnel Analysis
Dataset: ecommerce_funnel.csv
Tools: Excel / Python / Power BI
You are analyzing user behavior for an e-commerce platform. Despite strong traffic, conversion rates are lower than industry benchmarks.
- What % of users drop at each stage?
- Where is the highest drop-off?
- What is conversion rate?
- Time from view to purchase?
- Funnel visualization
- Conversion KPIs
- User journey insights
I mapped the full journey and found major drop-offs at checkout stage indicating friction and recommended UX improvements and remarketing strategies.
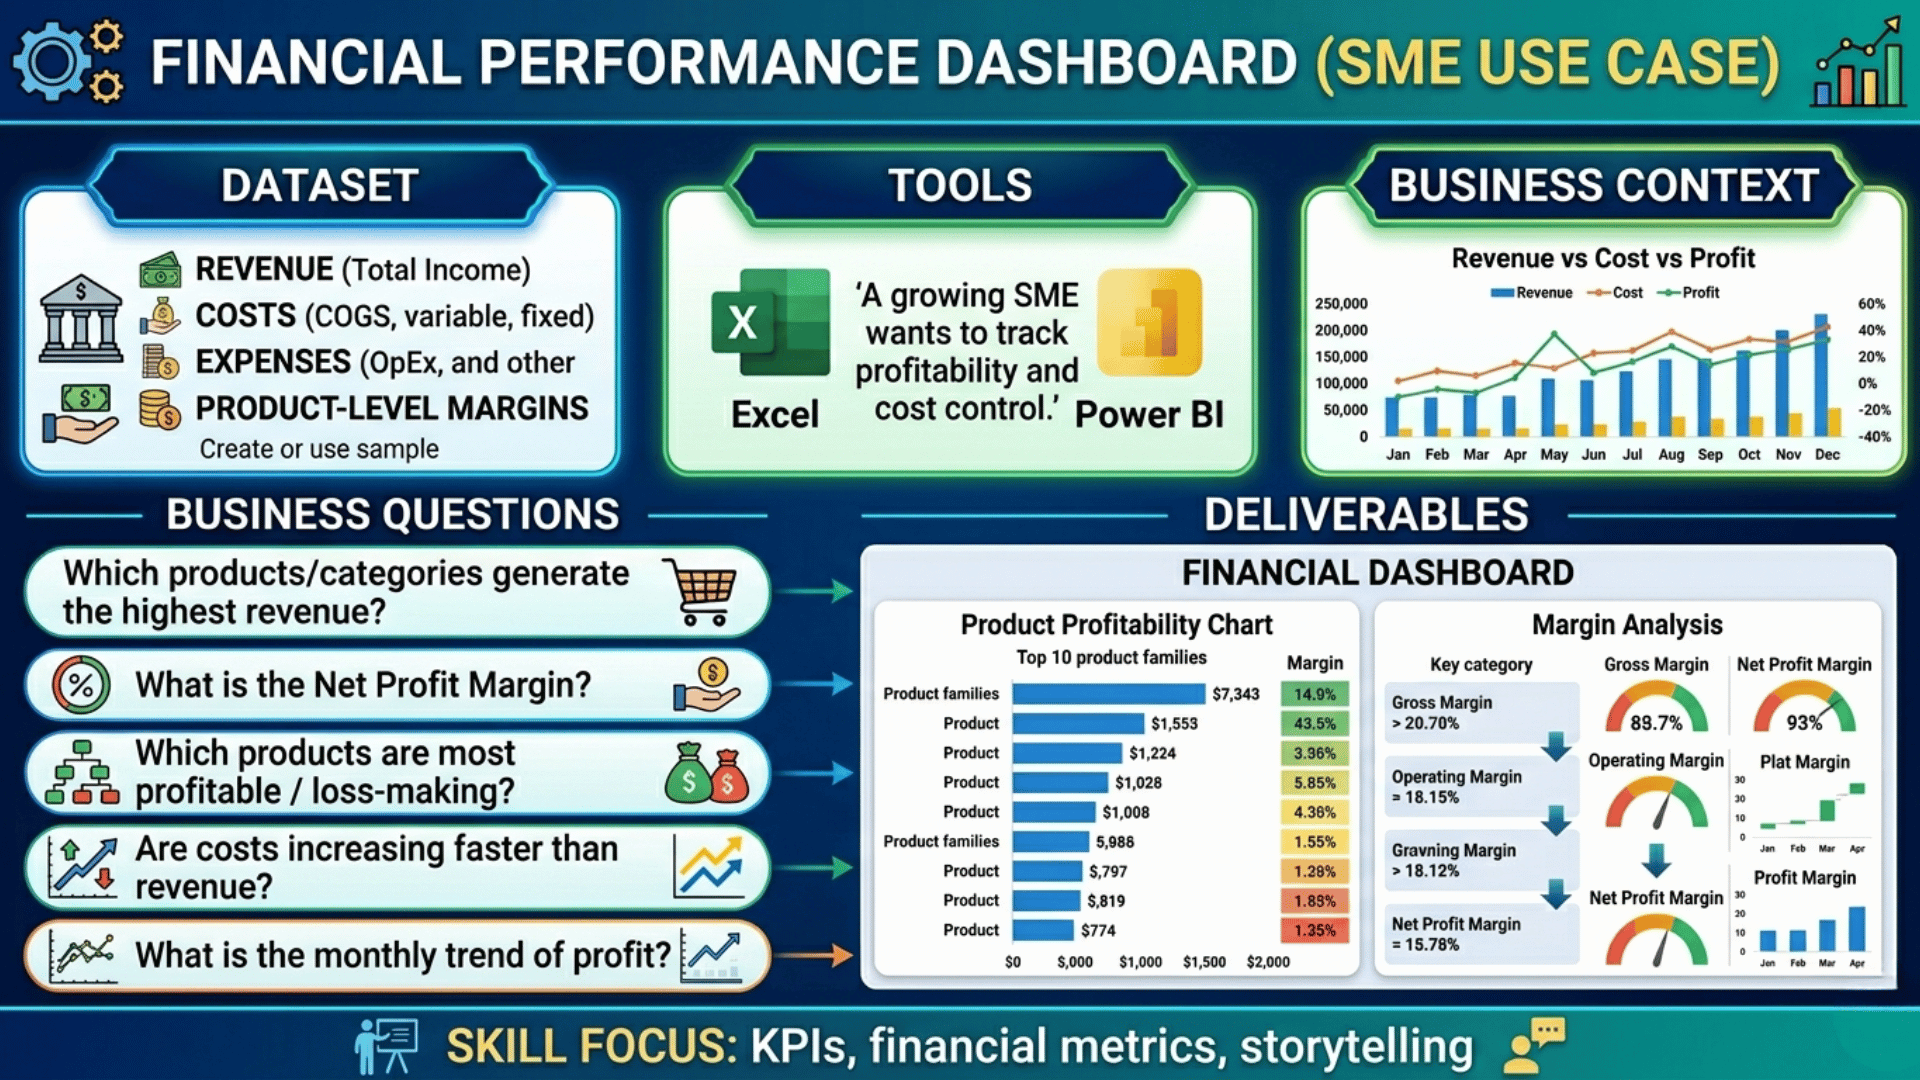
3. Financial Performance Dashboard
Dataset: financials.csv
Tools: Excel / Power BI
You are supporting leadership of a growing SME to understand profitability drivers.
- Net profit margin
- Cost trends
- Product profitability
Revenue growth masked cost inefficiencies.
- Margin instability
- Cost imbalance
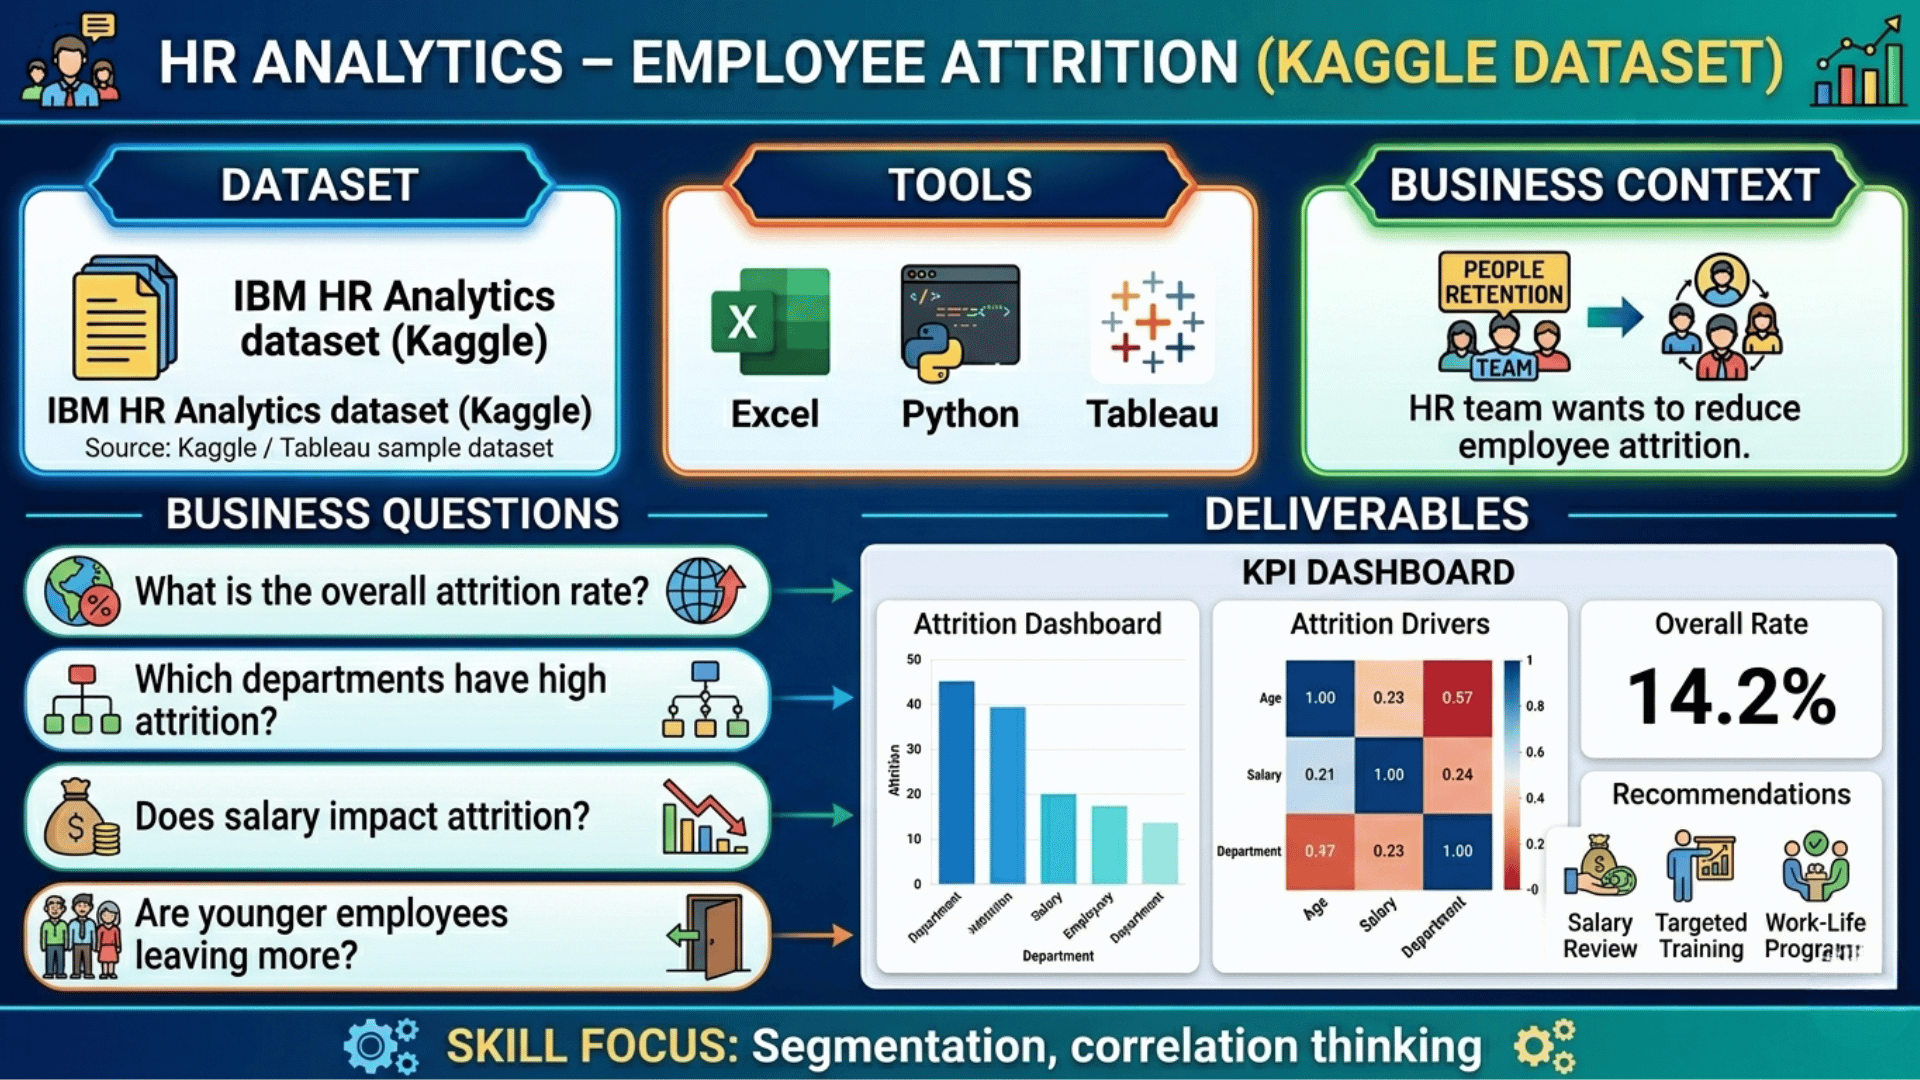
4. HR Attrition
Dataset: hr_attrition.csv
Tools: Excel / Power BI
- Attrition rate
- Salary impact
- Department trends
Young employees more likely to leave.
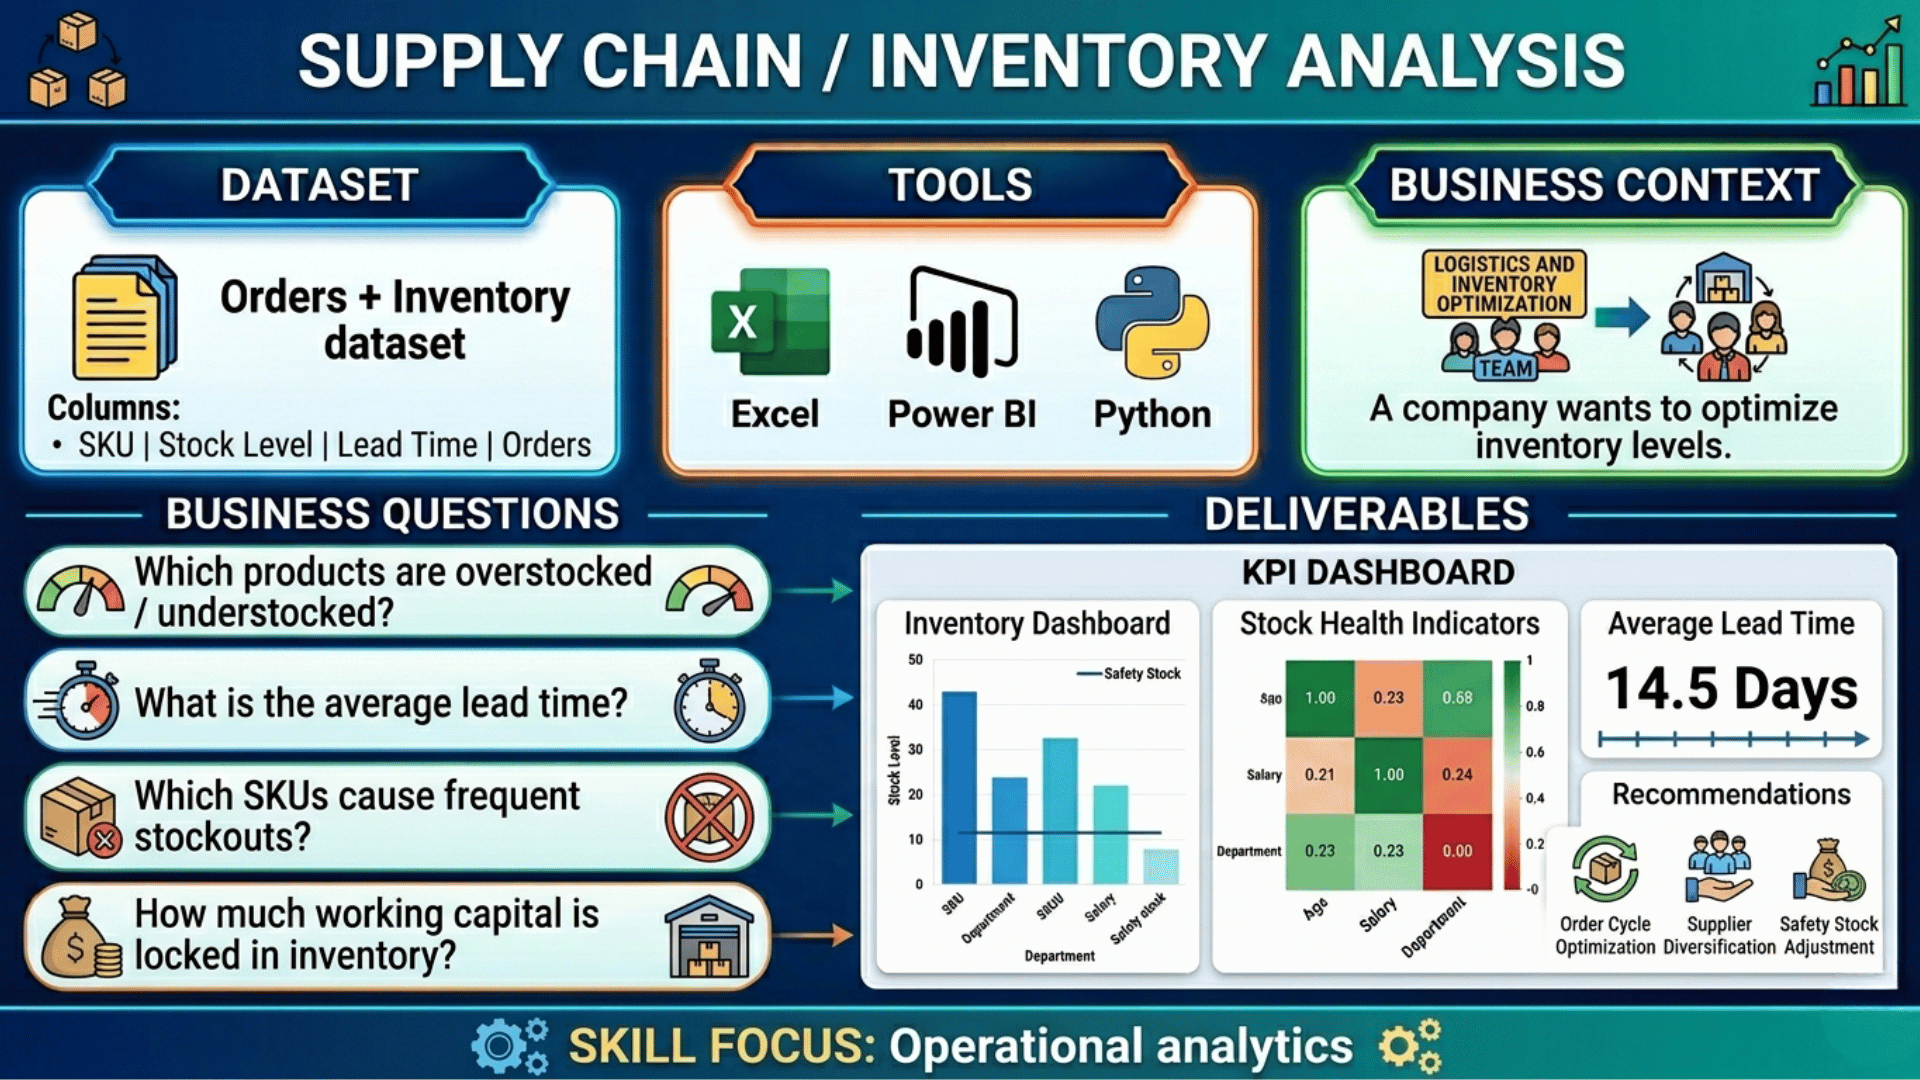
5. Inventory
Dataset: inventory.csv
Tools: Excel / Power BI
- Stockouts
- Overstock
- Lead time
Inventory imbalance identified.
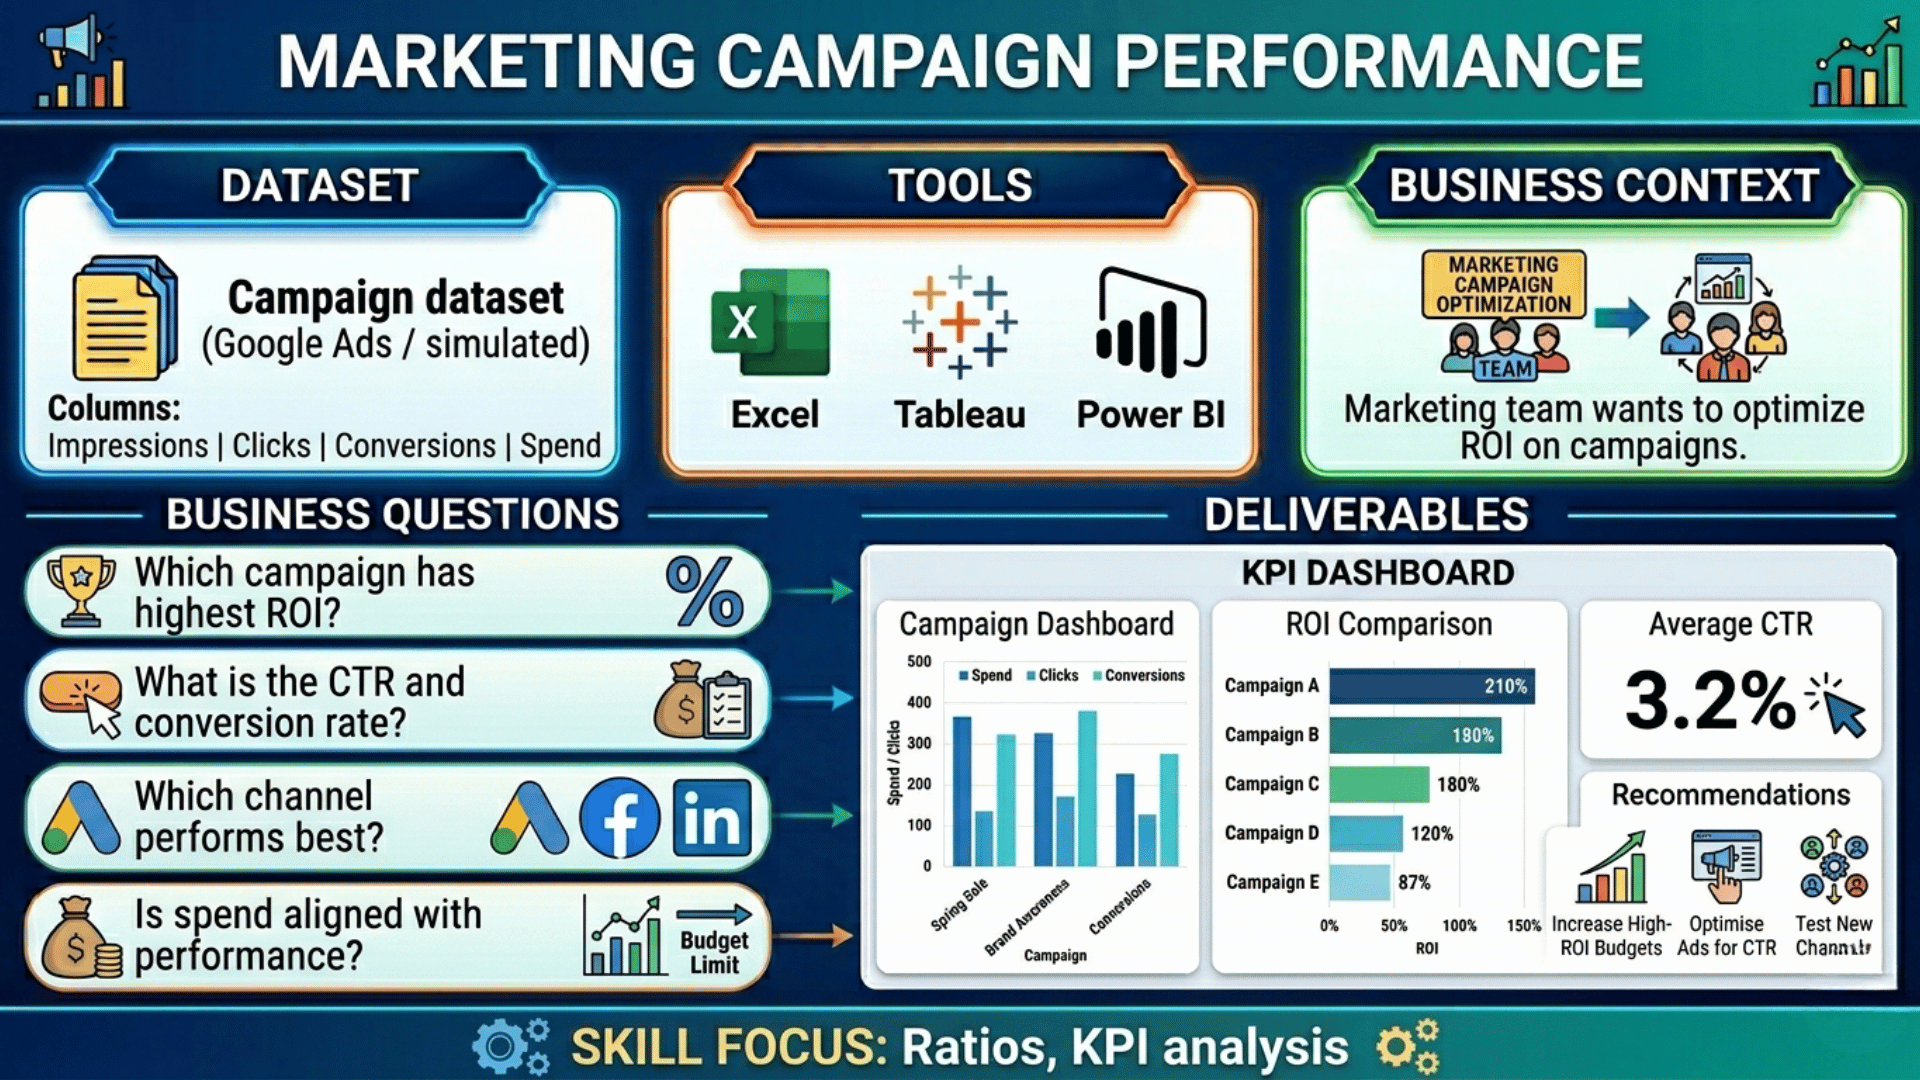
6. Marketing Campaign
Dataset: marketing_campaign.csv
Tools: Excel / Power BI
- ROI
- Conversion
- Spend efficiency
Budget misallocation observed.
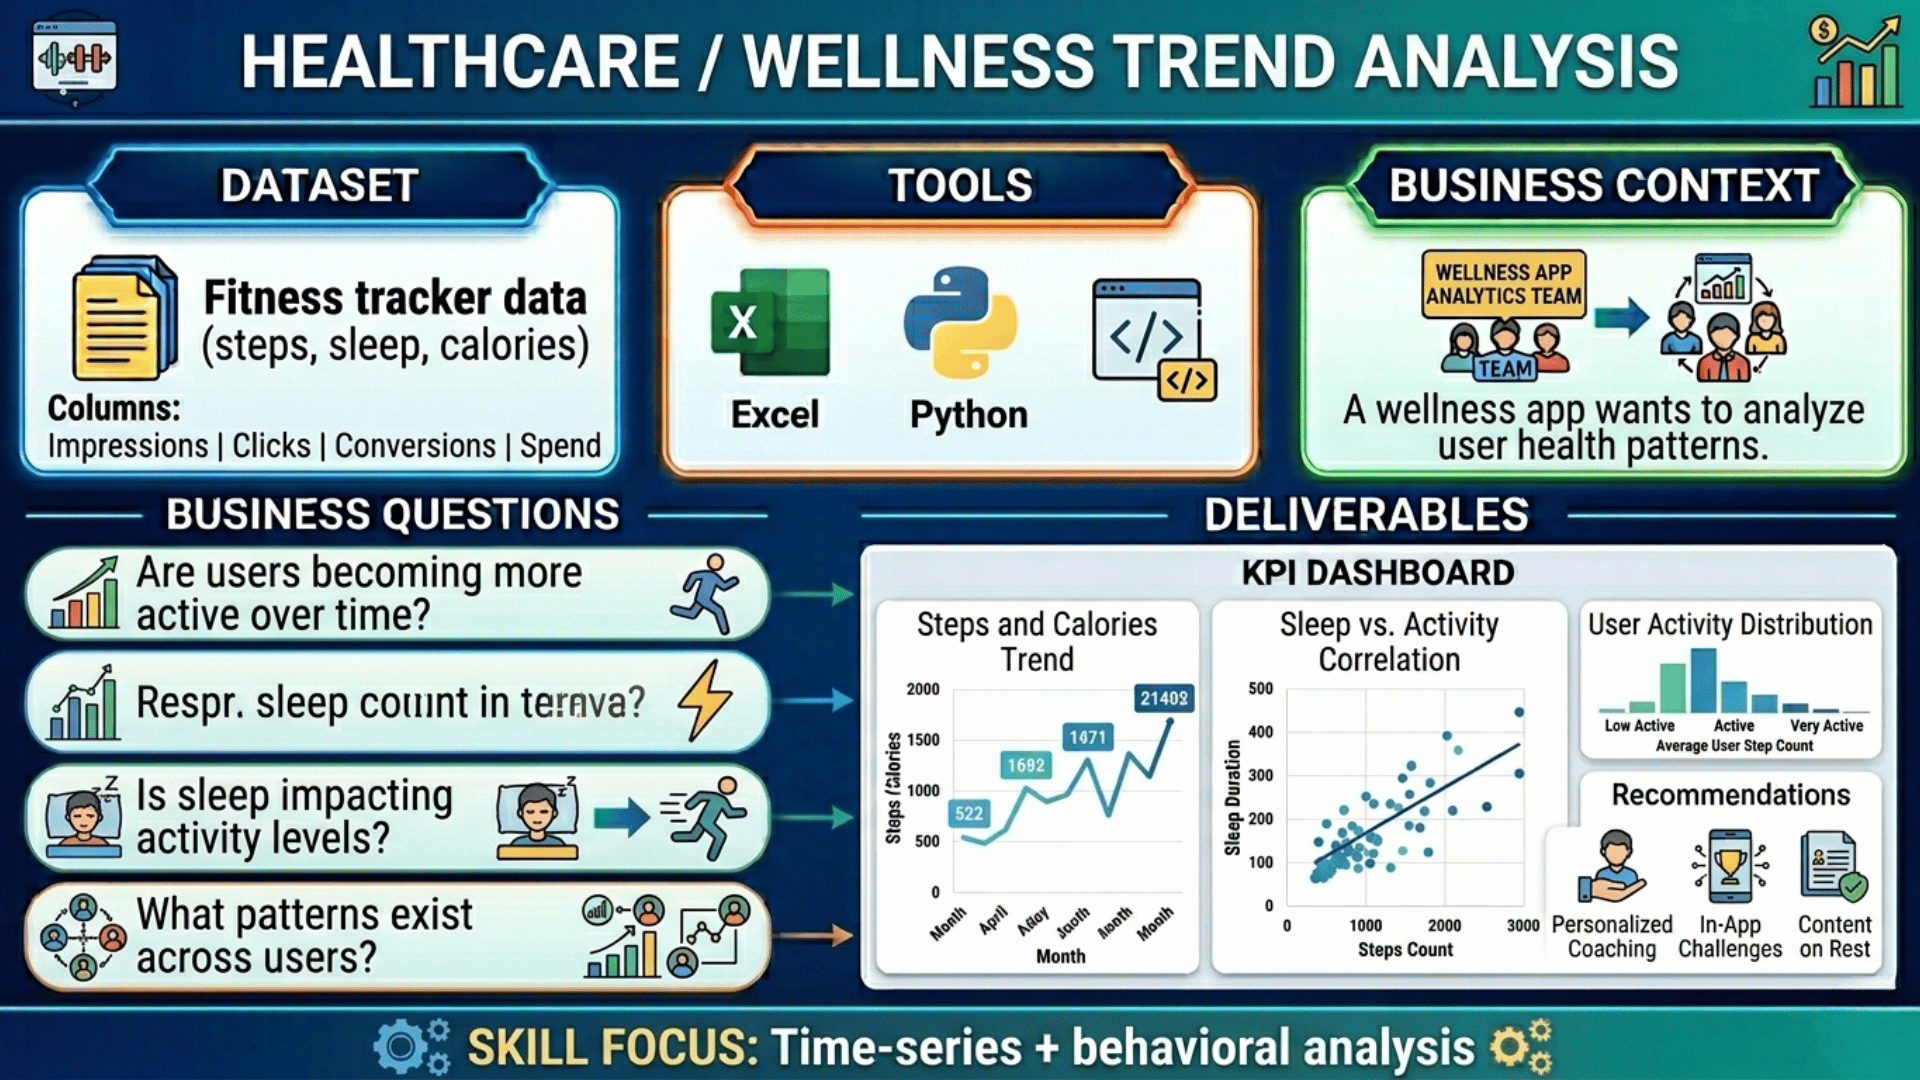
7. Wellness
Dataset: wellness.csv
Tools: Excel / Power BI
- Activity trends
- Sleep correlation
Behavioral segmentation possible.
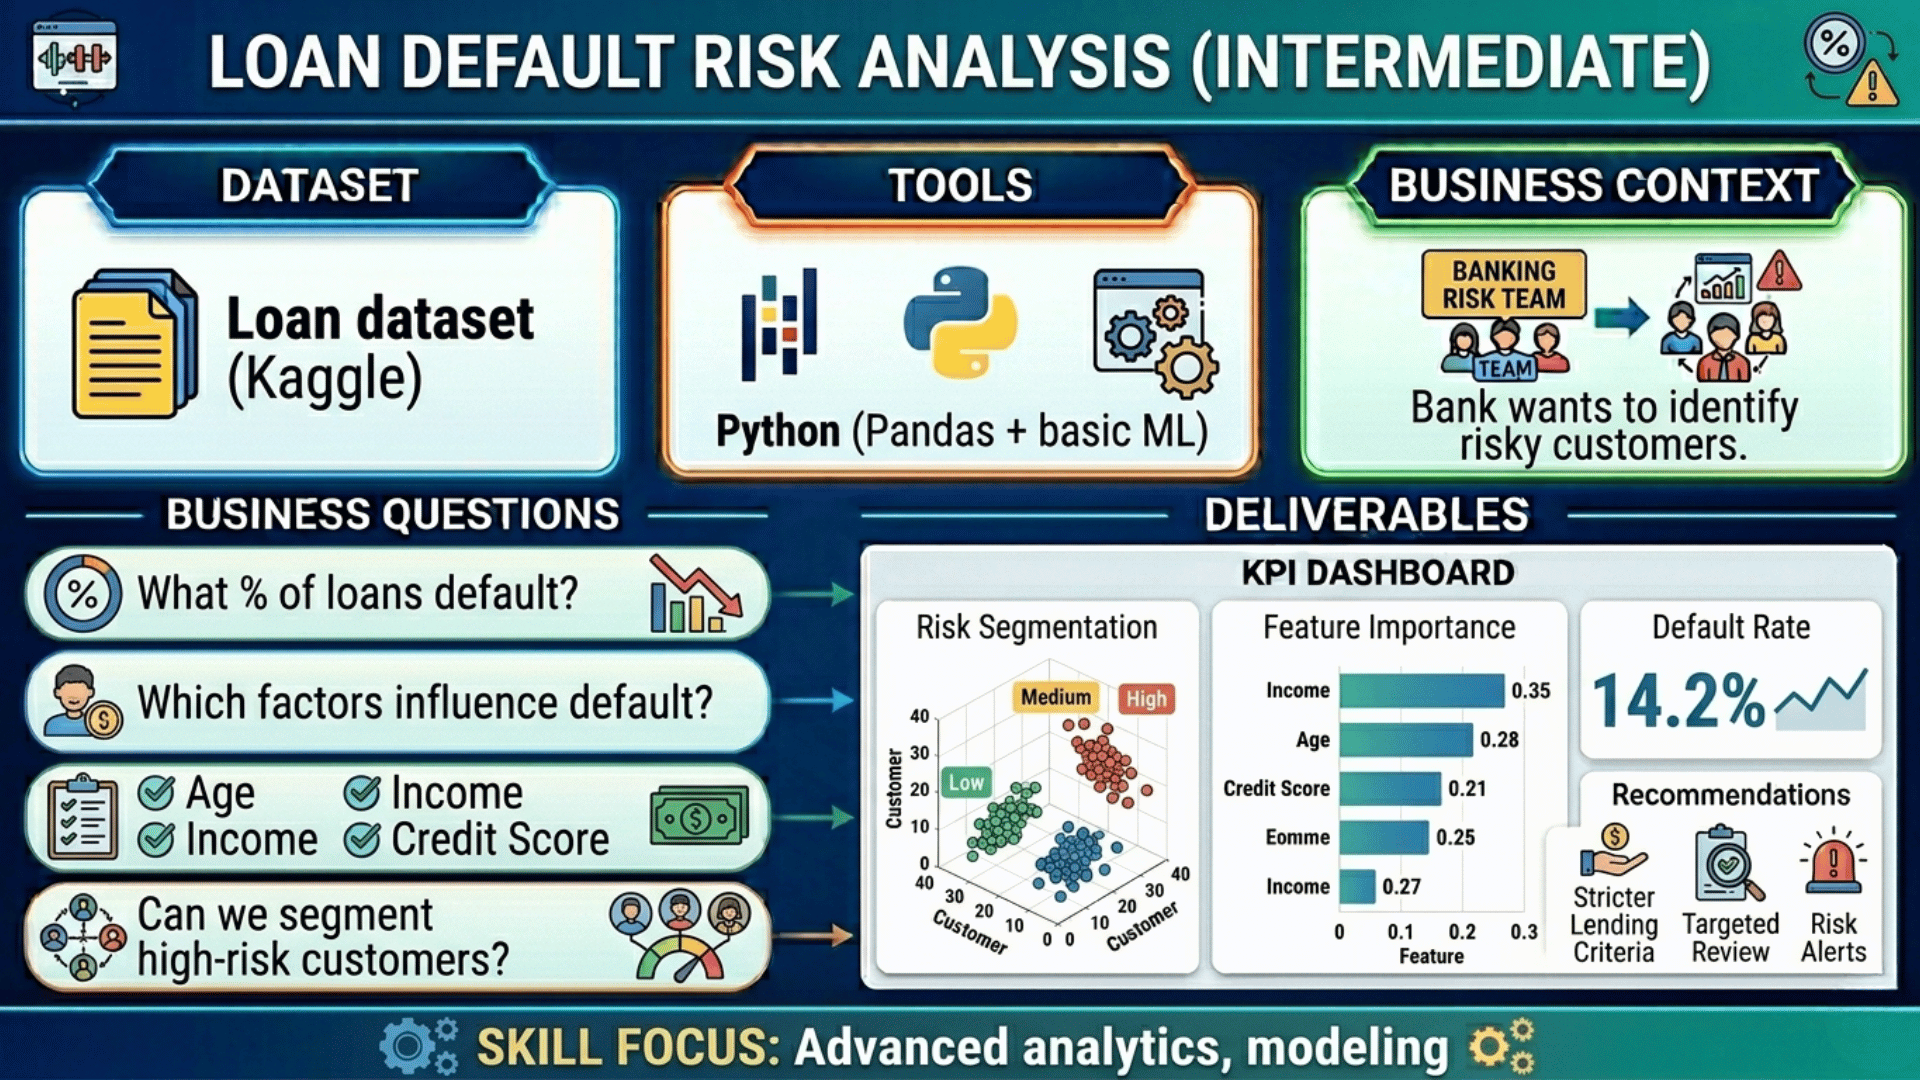
8. Loan Risk
Dataset: loan_data.csv
Tools: Excel / Power BI
- Default rate
- Risk segmentation
Credit score strong predictor.